
Friday, May 8, 2020
Monthly Average Movie Update - April 2022

Wednesday, March 11, 2020
2019 Sewells Point Update
Sea Level Rise Update 2019
This is the annual look at seawater levels at the NOAA Sewells Point water level gauge.
Caution -
Hours per year of nuisance flooding
First, the iconic plot of hours of nuisance flooding per year.

Nuisance flooding is a value determined by the National Weather Service in collaboration with regional emergency managers. It is 0.53 meters (1.7 feet) above Mean Higher High Water: the horizontal black line in the lower panel.
The upper panel shows:
1. There are occasional years with abnormally high hours of flooding. These are typical during a major hurricane or northeasters with long durations in the area.
2. There is a slow, steady increase from about 2005.
3. Based on this plot we can expect at least 40 to 50 hours of nuisance flooding per year in the coming years.
The lower panel shows
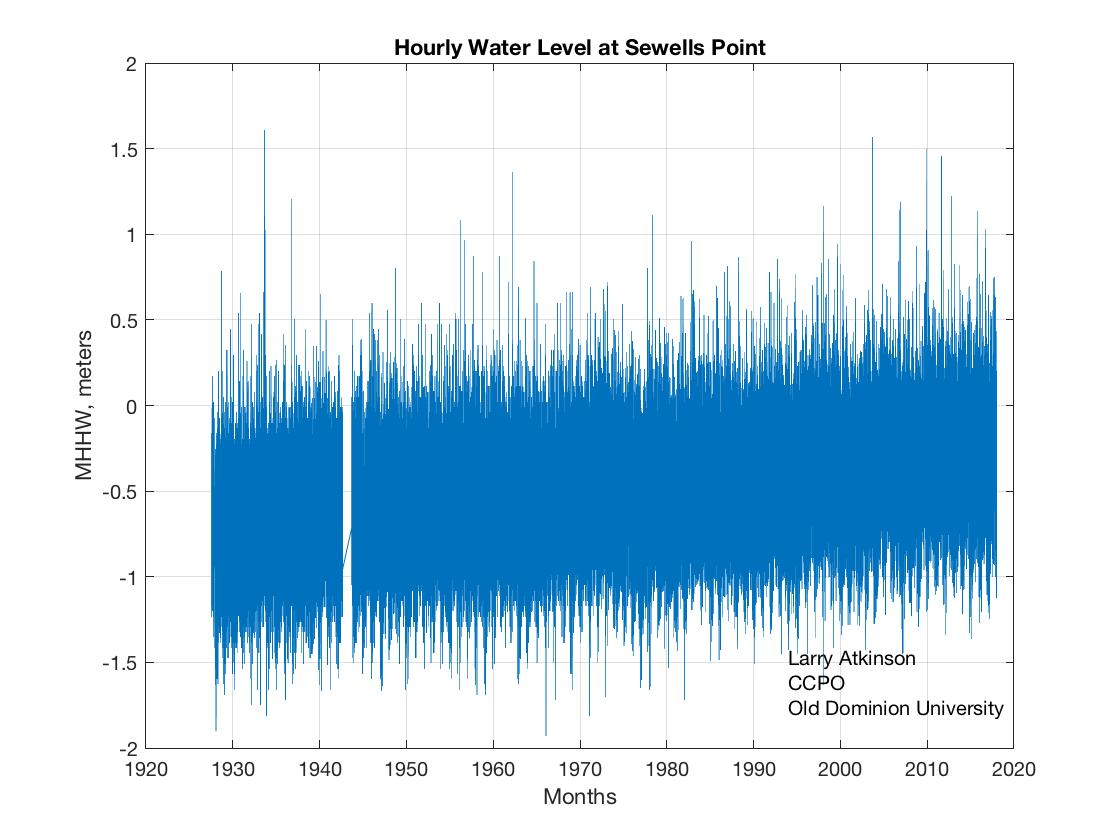
The lower panel shows the hourly water level since 1927. Since it is hourly you can see the twice-daily range in tides of about 1.5 meters or 3 feet. You can also see the occasional higher values well above 1 meter when hurricanes and northeasters pass our region.
Because of sea-level rise, the water levels are slowly increasing. The solid line is the nuisance flooding value of 0.53 m. You can see how the daily tides are slowly reaching more often into the nuisance flooding value. This is why we have more flooding.
Note - the hours of flooding are calculated assuming that any water level point above 0.53 m represents one hour of flooding. Thus, even if the water level was above 0.53 meters for one minute (unlikely) we count it as one hour.
Hourly Plot for the whole record for 2019

This is a plot of the water level measured every hour so you see the tidal range of a few feet and the variability month to month.
You can see that the water level can change over weeks to months. Changes in the ocean, wind fields and passage of hurricanes and northeasters cause these longer-term changes. The extreme values in September through December were caused by hurricanes and northeasters.
Average Monthly Water Levels

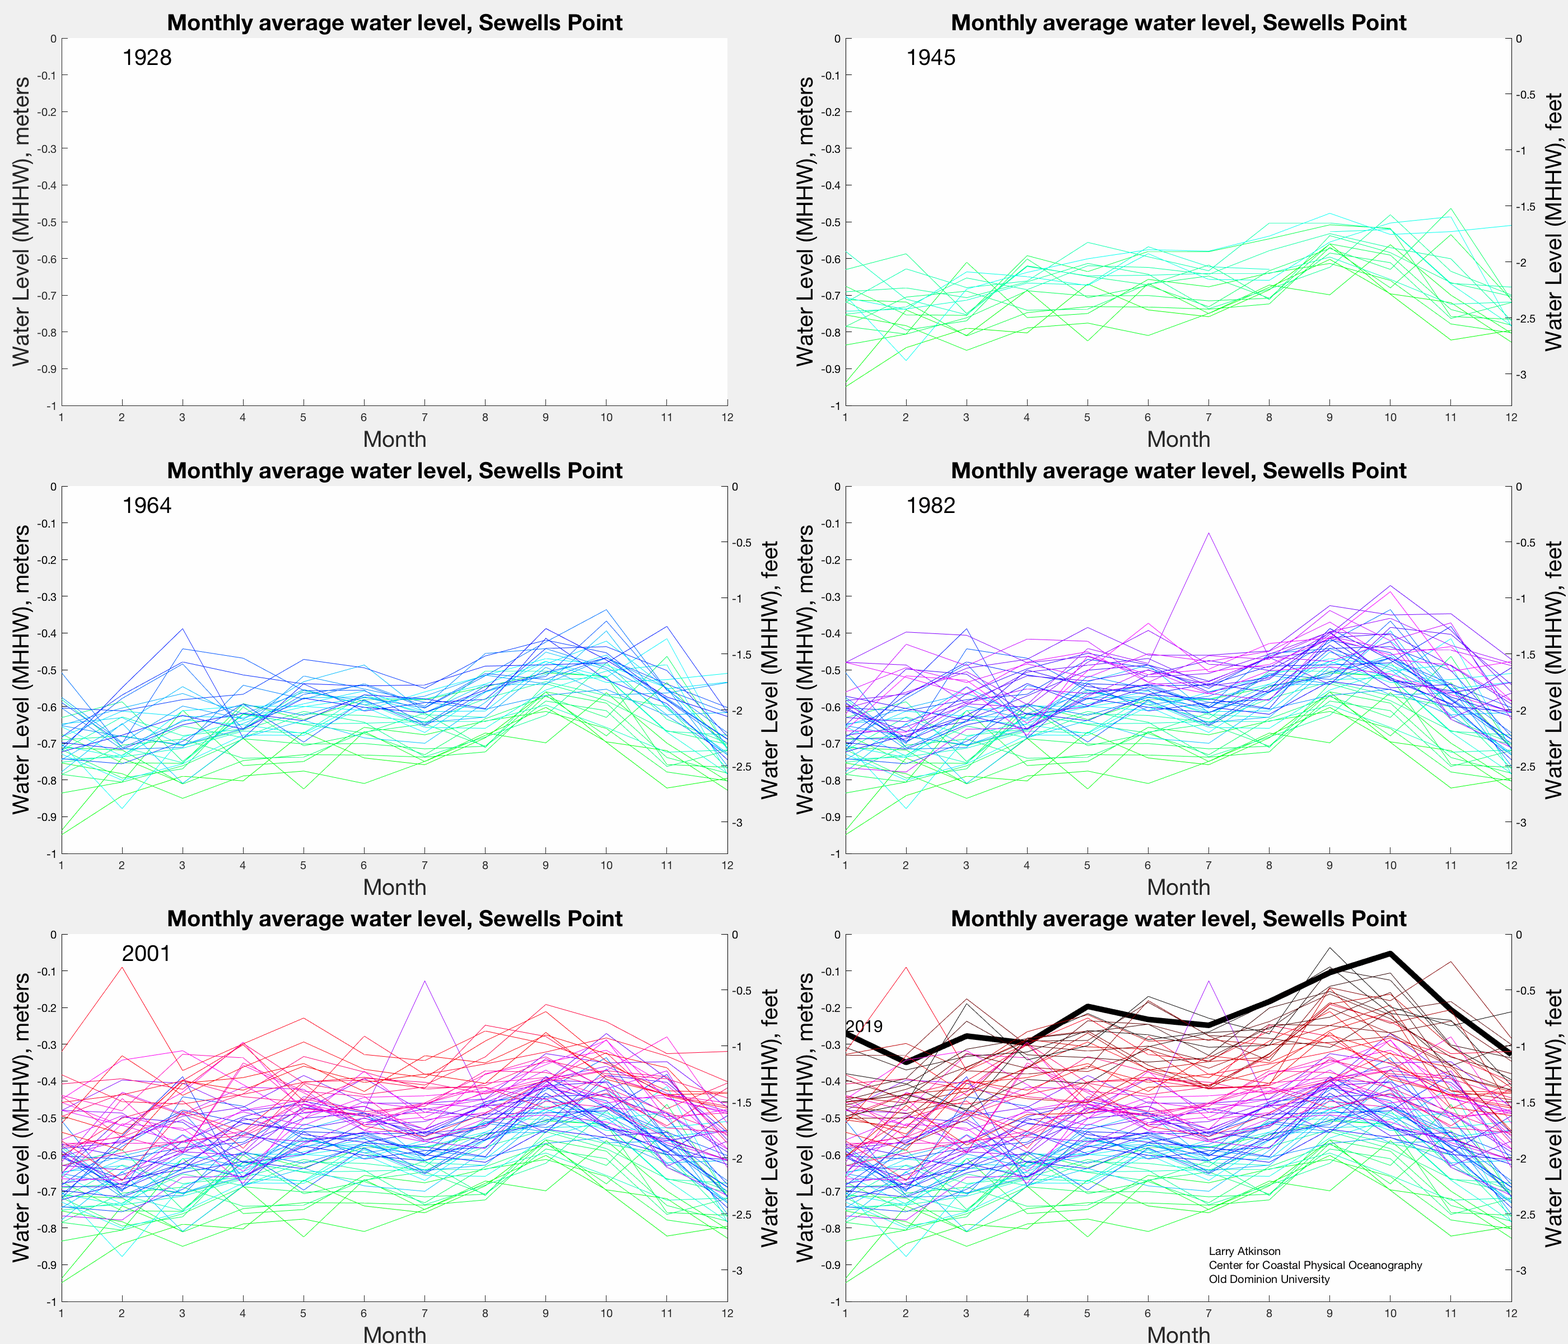
The above plot shows the average monthly water level for each month since 1928. The heavy line is the 2019 data. The monthly water levels for 2019 were in the top four for the entire record.
Ranking of months
This table shows the 10 highest months (highest to 10th highest). 2019 was in the first place 4 times, 3rd place once, 4th 4 times and 6th 2 times.
January 2019 2016 1998 2005 2010 2017 1996 2011 1993 2013
February 1998 2005 2010 1999 1983 2019 2016 2013 1993 1973
March 2010 2018 2013 2019 2014 1983 2011 1987 2016 2012
April 2010 2018 2013 2019 2014 1983 2011 1987 2016 2012
May 2019 2017 2005 1998 2011 2016 2008 2014 2006 2012
June 2018 2009 2012 2019 2014 2011 2016 1997 2017 2005
July 1975 2018 2019 2017 2015 2012 2009 2005 2011 2016
August 2019 2017 2014 2011 2010 1995 2013 2015 1998 2018
September 2018 2017 2016 2019 2015 2009 2003 2014 2011 2006
October 2019 2015 2016 2013 2004 2009 2005 2018 2012 2002
November 1928 1931 1936 1933 1934 1941 1929 1930 1943 1940
December 2018 2009 2012 2014 1996 2019 2015 2010 2011 2016
Average Monthly Water Level Movie
Now we show an animation of the monthly water level values from 1928 through 2019

Yearly Average
In 2019 the average water level was the highest since records began in 1928.
Ranking of years: 2019, 2018 2016 2010 2017 2014 2012 2009 2011 2005
 Flooding Return Period
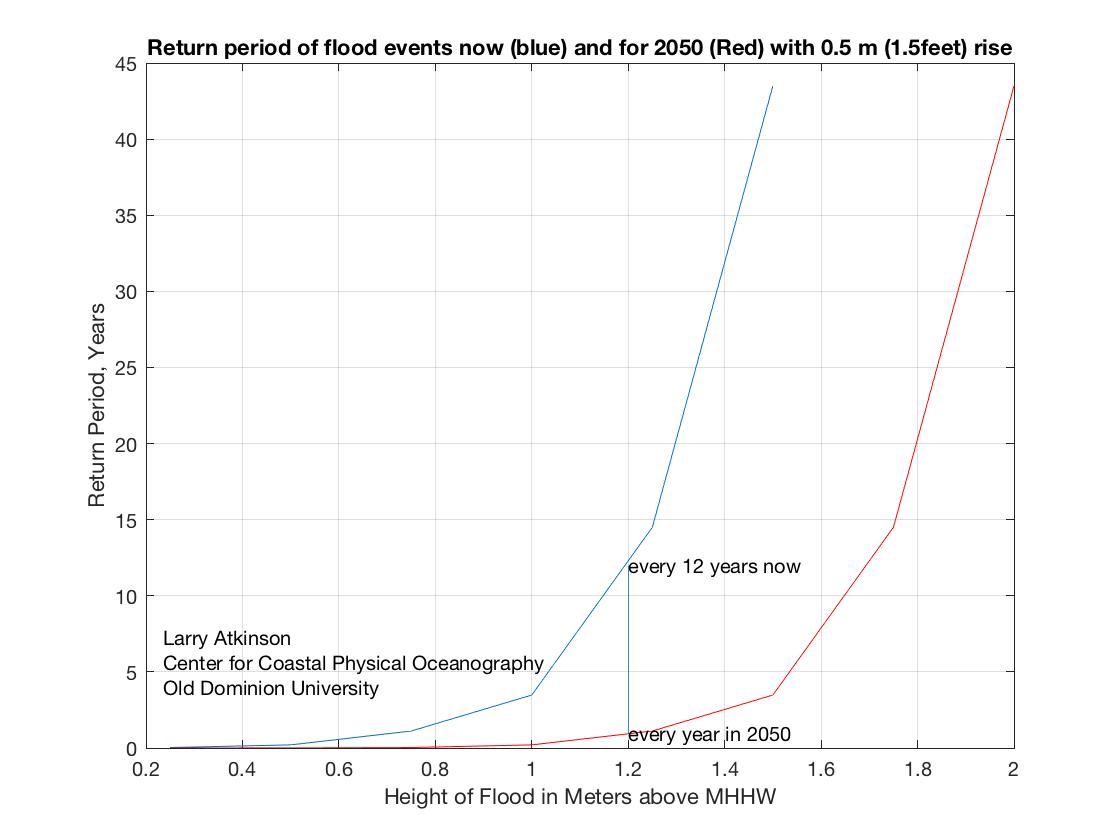
Floods 1.5 feet above MHHW occur every 12 years now on average. In 2050, when water levels are predicted to be higher by 1.5 feet flooding will occur every year.

Trends

The figure above is directly from the NOAA website. The linear trend is about 4.7 mm per year or 1.54 feet per century. Note that the most careful analysis of these records strongly suggest that the rate is not linear.
The Sea Level Rise Report Cards produced at the Virginia Institute of Marine Science are an excellent source of information on acceleration rates and the causes of sea-level rise.
I urge you to go to that site for more information on projected rise rates.
They calculate the current linear rate at 5.33 mm/year and the acceleration rate as 0.13 mm/year. Note that both numbers are slightly higher than last year.
This is the annual look at seawater levels at the NOAA Sewells Point water level gauge.
Caution -
- There are many nuances to this data and interpretations of it.
- Do not make decisions based on the information here
- Contact me if you plan to use the information presented here.
- The average annual water level for the whole year 2019 was the highest since 1928.
- Hours of nuisance flooding was 5th highest since 1928.
- The monthly average water level was highest on record in January, May, August, and October. It was the third-highest in July.
- By 2050 floods that used to happen every 12 years will happen every year.
Hours per year of nuisance flooding
First, the iconic plot of hours of nuisance flooding per year.

Nuisance flooding is a value determined by the National Weather Service in collaboration with regional emergency managers. It is 0.53 meters (1.7 feet) above Mean Higher High Water: the horizontal black line in the lower panel.
The upper panel shows:
1. There are occasional years with abnormally high hours of flooding. These are typical during a major hurricane or northeasters with long durations in the area.
2. There is a slow, steady increase from about 2005.
3. Based on this plot we can expect at least 40 to 50 hours of nuisance flooding per year in the coming years.
The lower panel shows
The lower panel shows the hourly water level since 1927. Since it is hourly you can see the twice-daily range in tides of about 1.5 meters or 3 feet. You can also see the occasional higher values well above 1 meter when hurricanes and northeasters pass our region.
Because of sea-level rise, the water levels are slowly increasing. The solid line is the nuisance flooding value of 0.53 m. You can see how the daily tides are slowly reaching more often into the nuisance flooding value. This is why we have more flooding.
Note - the hours of flooding are calculated assuming that any water level point above 0.53 m represents one hour of flooding. Thus, even if the water level was above 0.53 meters for one minute (unlikely) we count it as one hour.
Hourly Plot for the whole record for 2019

This is a plot of the water level measured every hour so you see the tidal range of a few feet and the variability month to month.
You can see that the water level can change over weeks to months. Changes in the ocean, wind fields and passage of hurricanes and northeasters cause these longer-term changes. The extreme values in September through December were caused by hurricanes and northeasters.
Average Monthly Water Levels

The above plot shows the average monthly water level for each month since 1928. The heavy line is the 2019 data. The monthly water levels for 2019 were in the top four for the entire record.
Ranking of months
This table shows the 10 highest months (highest to 10th highest). 2019 was in the first place 4 times, 3rd place once, 4th 4 times and 6th 2 times.
January 2019 2016 1998 2005 2010 2017 1996 2011 1993 2013
February 1998 2005 2010 1999 1983 2019 2016 2013 1993 1973
March 2010 2018 2013 2019 2014 1983 2011 1987 2016 2012
April 2010 2018 2013 2019 2014 1983 2011 1987 2016 2012
May 2019 2017 2005 1998 2011 2016 2008 2014 2006 2012
June 2018 2009 2012 2019 2014 2011 2016 1997 2017 2005
July 1975 2018 2019 2017 2015 2012 2009 2005 2011 2016
August 2019 2017 2014 2011 2010 1995 2013 2015 1998 2018
September 2018 2017 2016 2019 2015 2009 2003 2014 2011 2006
October 2019 2015 2016 2013 2004 2009 2005 2018 2012 2002
November 1928 1931 1936 1933 1934 1941 1929 1930 1943 1940
December 2018 2009 2012 2014 1996 2019 2015 2010 2011 2016
Average Monthly Water Level Movie
Now we show an animation of the monthly water level values from 1928 through 2019
Yearly Average
In 2019 the average water level was the highest since records began in 1928.
Ranking of years: 2019, 2018 2016 2010 2017 2014 2012 2009 2011 2005

Floods 1.5 feet above MHHW occur every 12 years now on average. In 2050, when water levels are predicted to be higher by 1.5 feet flooding will occur every year.

Trends

The figure above is directly from the NOAA website. The linear trend is about 4.7 mm per year or 1.54 feet per century. Note that the most careful analysis of these records strongly suggest that the rate is not linear.
The Sea Level Rise Report Cards produced at the Virginia Institute of Marine Science are an excellent source of information on acceleration rates and the causes of sea-level rise.
I urge you to go to that site for more information on projected rise rates.
They calculate the current linear rate at 5.33 mm/year and the acceleration rate as 0.13 mm/year. Note that both numbers are slightly higher than last year.
Wednesday, July 17, 2019
Monthly Average Movie Update - December 2019

Here is the final plot monthly averaged movie for 2019. The data are the monthly averaged hourly data from NOAA: we take all the hourly data from, for example July 2019, and average it. The monthly averages for 2019 appear to all be in the top four since 1928. More plots coming as we work through 2019.
Monday, January 28, 2019
Sewells Point 2018
Sea Level Rise Update 2018
This is the annual look at seawater levels at the NOAA Sewells Point water level gauge. I'm trying to do this every year.
Caution -
Note: all plots are referenced to Mean Higher High Water (MHHW).
Hours per year of nuisance flooding
First, the iconic plot of hours of nuisance flooding per year.

Nuisance flooding is a value determined by the National Weather Service in collaboration with regional emergency managers. It is 0.53 meters above Mean Higher High Water.
The upper plot shows two things:
1. there are occasional years with abnormally high hours of flooding. These are typical during a major hurricane or northeasters with long durations in the area.
2. a slow, steady increase from about 2005.
Based on this plot we can expect at least 40 to 50 hours of nuisance flooding per year in the coming years.
The lower panel shows the hourly water level since 1927. Since it is hourly you can see the twice-daily range in tides of about 1.5 meters or 3 feet. You can also see the occasional higher values well above 1 meter when hurricanes and northeasters pass our region.
Because of sea level rise, the water levels are slowly increasing. The solid line is the nuisance flooding value of 0.53 m. You can see how the daily tides are slowly reaching more often into the nuisance flooding value. This is why we have more flooding.
Note - the hours of flooding is calculated assuming that any water level point above 0.53 m represents one hour of flooding.
Average Monthly Water Level Movie
Now for something new - an animation of the monthly water level values from 1928 to the present

The hourly plot for 2018

Remember, this is a plot of the water level every hour so you see the tidal range of a few feet.
You can see that the water level can change over the months. In January it went from below -0.5 to averaging above 0 in March. Changes in the ocean, wind fields and passage of hurricanes and northeasters cause these longer-term changes.
Monthly Averages
We often hear things like 'this was the hottest month in history', or, 'the hottest year in history'. Well, we can do the same thing with the water level at Sewells Point.

This plot shows the monthly average water level at Sewells Point since 1927. Each line represents one year. The heavy line shows the 2018 data.
First, you notice that water levels are always higher in the late summer and lowest in the winter months. This is because the ocean waters are warmer in the summer and the ocean expands a bit each summer: in this case about 0.5 meters or 1.5 feet.
The data for 2018 (the heavy line shows that water levels monthly averages were among the highest.
Ranking of months
This table shows that the average monthly water level was the highest ever in June, September, and December. It was the second highest in March and July.
1 2 3 4 5 6 7 8 9 10
January 2016 1998 2005 2010 2017 1996 2011 1993 2013 1987
February 1998 2005 2010 1999 1983 2016 2013 1993 1973 2017
March 2010 2018 2013 2014 1983 2011 1987 2016 2012 2003
April 2010 2018 2013 2014 1983 2011 1987 2016 2012 2003
May 2017 2005 1998 2011 2016 2008 2014 2006 2012 1999
June 2018 2009 2012 2014 2011 2016 1997 2017 2005 2010
July 1975 2018 2017 2015 2012 2009 2005 2011 2016 2014
August 2017 2014 2011 2010 1995 2013 2015 1998 2018 2012
September 2018 2017 2016 2015 2009 2003 2014 2011 2006 2004
October 2015 2016 2013 2004 2009 2005 2018 2012 2002 2017
November 1928 1931 1936 1933 1934 1941 1929 1930 1943 1940
December 2018 2009 2012 2014 1996 2015 2010 2011 2016 1997
Yearly Average
In 2018 the average water level was the highest since records began in 1928.
Ranking of years: 2018, 2016, 2010, 2017, 2014, 2012, 2009, 2011, 2005, 1998, 2013, 2015, 2006, 1996, 2003
 The ranking of highest years is: 2018 2016 2010 2017 2014 2012 2009 2011 2005 1998
8 of 10 highest annual average was since 2000.
Flooding Return Period

This shows that at present a flood of 1.2 meters above MLLW occurs about every 12 years. With a 0.5-meter water level rise the return period will be about every year. Or, a flood that used to happen every 12 years will, in 50 years, happen every year.
Trends
 The figure above is directly from the NOAA website. The linear trend is about 4.6 ft per century. Note that most careful analysis of these records strongly suggest that the rate is not linear.
The Sea Level Rise Report Cards produced at the Virginia Institute of Marine Science are an excellent source of information on acceleration rates and the causes of sea level rise.
I urge you to go to that site for more information on projected rise rates.
They calculate the current linear rate at 5.2 mm/year and the acceleration rate as 0.1 mm/year.
Background information
All the data are from the NOAA data archive for Sewells Point. LINK
All water levels are referenced to MHHW. To convert to different datums see LINK
All data are one hour. Note that verified 6-minute data are available at this station since 1996. Using 6-minute data would give you more accurate hourly flooding data.
If you want the full data sets please contact me.

This is the annual look at seawater levels at the NOAA Sewells Point water level gauge. I'm trying to do this every year.
Caution -
- There are many nuances to this data and interpretations of it.
- Do not make decisions based on the information here
- Contact me if you plan to use the information presented here.
- The average annual water level for the whole year 2018 was the highest since 1928.
- Hours of nuisance flooding was 5th highest since 1928.
- The monthly average water level was the highest on record in June, September and December. It was the second highest in March and July.
- By 2050 floods that used to happen every 12 years will happen every year.
Note: all plots are referenced to Mean Higher High Water (MHHW).
Hours per year of nuisance flooding
First, the iconic plot of hours of nuisance flooding per year.

Nuisance flooding is a value determined by the National Weather Service in collaboration with regional emergency managers. It is 0.53 meters above Mean Higher High Water.
The upper plot shows two things:
1. there are occasional years with abnormally high hours of flooding. These are typical during a major hurricane or northeasters with long durations in the area.
2. a slow, steady increase from about 2005.
Based on this plot we can expect at least 40 to 50 hours of nuisance flooding per year in the coming years.
The lower panel shows the hourly water level since 1927. Since it is hourly you can see the twice-daily range in tides of about 1.5 meters or 3 feet. You can also see the occasional higher values well above 1 meter when hurricanes and northeasters pass our region.
Because of sea level rise, the water levels are slowly increasing. The solid line is the nuisance flooding value of 0.53 m. You can see how the daily tides are slowly reaching more often into the nuisance flooding value. This is why we have more flooding.
Note - the hours of flooding is calculated assuming that any water level point above 0.53 m represents one hour of flooding.
Average Monthly Water Level Movie
Now for something new - an animation of the monthly water level values from 1928 to the present

The hourly plot for 2018

Remember, this is a plot of the water level every hour so you see the tidal range of a few feet.
You can see that the water level can change over the months. In January it went from below -0.5 to averaging above 0 in March. Changes in the ocean, wind fields and passage of hurricanes and northeasters cause these longer-term changes.
Monthly Averages
We often hear things like 'this was the hottest month in history', or, 'the hottest year in history'. Well, we can do the same thing with the water level at Sewells Point.

This plot shows the monthly average water level at Sewells Point since 1927. Each line represents one year. The heavy line shows the 2018 data.
First, you notice that water levels are always higher in the late summer and lowest in the winter months. This is because the ocean waters are warmer in the summer and the ocean expands a bit each summer: in this case about 0.5 meters or 1.5 feet.
The data for 2018 (the heavy line shows that water levels monthly averages were among the highest.
Ranking of months
This table shows that the average monthly water level was the highest ever in June, September, and December. It was the second highest in March and July.
1 2 3 4 5 6 7 8 9 10
January 2016 1998 2005 2010 2017 1996 2011 1993 2013 1987
February 1998 2005 2010 1999 1983 2016 2013 1993 1973 2017
March 2010 2018 2013 2014 1983 2011 1987 2016 2012 2003
April 2010 2018 2013 2014 1983 2011 1987 2016 2012 2003
May 2017 2005 1998 2011 2016 2008 2014 2006 2012 1999
June 2018 2009 2012 2014 2011 2016 1997 2017 2005 2010
July 1975 2018 2017 2015 2012 2009 2005 2011 2016 2014
August 2017 2014 2011 2010 1995 2013 2015 1998 2018 2012
September 2018 2017 2016 2015 2009 2003 2014 2011 2006 2004
October 2015 2016 2013 2004 2009 2005 2018 2012 2002 2017
November 1928 1931 1936 1933 1934 1941 1929 1930 1943 1940
December 2018 2009 2012 2014 1996 2015 2010 2011 2016 1997
Yearly Average
In 2018 the average water level was the highest since records began in 1928.
Ranking of years: 2018, 2016, 2010, 2017, 2014, 2012, 2009, 2011, 2005, 1998, 2013, 2015, 2006, 1996, 2003

8 of 10 highest annual average was since 2000.
Flooding Return Period
Trends

The Sea Level Rise Report Cards produced at the Virginia Institute of Marine Science are an excellent source of information on acceleration rates and the causes of sea level rise.
I urge you to go to that site for more information on projected rise rates.
They calculate the current linear rate at 5.2 mm/year and the acceleration rate as 0.1 mm/year.
Background information
All the data are from the NOAA data archive for Sewells Point. LINK
All water levels are referenced to MHHW. To convert to different datums see LINK
All data are one hour. Note that verified 6-minute data are available at this station since 1996. Using 6-minute data would give you more accurate hourly flooding data.
If you want the full data sets please contact me.

Wednesday, December 26, 2018
Maryland Updates its Sea Level Rise Projections
From the report
"The new projections do not differ substantially from those provided in 2013, but the probability distributions can be useful in planning and regulation, infrastructure siting and design, estimation of changes in tidal range and storm surge, developing inundation mapping tools, and adaptation strategies for high-tide flooding and saltwater intrusion."

Wednesday, May 2, 2018
NASA SLR Data Tool
NASA now has the following

The NASA Sea Level Change Data Analysis Tool (DAT) has been designed to allow for quick-look comparisons and analysis of NASA datasets of sea level change. The datasets range from sea level observations, to ice observations, to model output to quickly study anomalies and get immediate results on potential relations between different datasets. For computational reasons, all data have been interpolated to a 1x1 degree grid. Full datasets can be download through the database for further analysis.

Launch tool at https://sealevel.nasa.gov/data/data-analysis-tool
Caution - this data is probably not meant to be used in coastal waters.
Tuesday, January 2, 2018
Sea Level Rise for Hampton Roads 2017
Sea Water Levels at Sewells Point, VA
With the end of the year, it is a good time to recap the data we have on flooding events and sea level rise for the Hampton Roads region.
Hourly Data at Sewells Point
Average Annual Sea Level at Sewells Point

10 Year moving average at Sewells Point

Hours per year of Nuisance Flooding

Return Period of Flooding Events

Rate of Sea Level Rise

The trend has increased from 4.59 to 4.61mm/year since last year.
The past year - 2017

2017 Compared to other years by month

You will notice that the highest water levels during any year are often in September. This is because the ocean waters are warmest then and they have expanded - making sea level higher. This is a seasonal effect.
Thursday, December 14, 2017
Hampton Roads Tide Predictions
Local Tide Predictions for Hampton Roads
There are many locations throughout Hampton Roads that NOAA provides tide predictions for.
The list of locations that have predictions is at https://tidesandcurrents.noaa.gov/tide_predictions.html?gid=1414
Graphically they are shown at https://tidesandcurrents.noaa.gov/gmap3/index.shtml?type=TidePredictions®ion=
Following is an image of the locations provided:

There are many locations throughout Hampton Roads that NOAA provides tide predictions for.
The list of locations that have predictions is at https://tidesandcurrents.noaa.gov/tide_predictions.html?gid=1414
Graphically they are shown at https://tidesandcurrents.noaa.gov/gmap3/index.shtml?type=TidePredictions®ion=
Following is an image of the locations provided:

Friday, November 10, 2017
National Climate Assessment 2017

Volume 1 "Climate Science Special Report" of the Fourth National Climate Assessment has been released.
The key findings for the Sea Level Rise Chapter (12) are on page 333.
Draft Integrated City of Norfolk Coastal Storm Risk Management Feasibility Report /Environmental Impact

The "Draft Integrated City of Norfolk Coastal Storm Risk Management Feasibility Report /Environmental Impact" for Norfolk VA has been released Draft Integrated City of Norfolk Coastal Storm Risk Management Feasibility Report /Environmental Impact
The PDF of the report is at http://cdm16021.contentdm.oclc.org/utils/getfile/collection/p16021coll7/id/5483
This is a great resource for information.
This is a great resource for information.
Saturday, September 2, 2017
Tracking Hurricane Irma
With Hurricane Irma coming our way I'm posting some information as we watch the forecasts.
Forecasts suggest that if Irma does come our way it would be Sat/Sun/Monday September 9/10/11
Tides will be high around noon and midnight on those days.

Storm surge predictions for Sewells Point are HERE
5 day forecast animation by the National Hurricane Center
The website Tropical Tidbits provides a very good narrative every few days in a 10-minute video cast. Also under the various tabs there are well-organized model results. Click around it and enjoy. The author is a grad student at FSU so donate a bit if you like it. I'm sure he could use the $.
Our friends at UNC have the ADCIRC Model now running for Irma. It shows the hurricane track, predicted storm surge, and much more. LINK
I'll be adding to this as Irma approaches.
Evacuation - Evacuation orders will be given based on the 'know your zone' scheme. Go to Know Your Zone and find which of the four zones you are in. Helpful tip - go to LINK and enter your address in the upper left 'find address or place'. Good luck.
Forecasts suggest that if Irma does come our way it would be Sat/Sun/Monday September 9/10/11
Tides will be high around noon and midnight on those days.
Storm surge predictions for Sewells Point are HERE
5 day forecast animation by the National Hurricane Center
The website Tropical Tidbits provides a very good narrative every few days in a 10-minute video cast. Also under the various tabs there are well-organized model results. Click around it and enjoy. The author is a grad student at FSU so donate a bit if you like it. I'm sure he could use the $.
Our friends at UNC have the ADCIRC Model now running for Irma. It shows the hurricane track, predicted storm surge, and much more. LINK
I'll be adding to this as Irma approaches.
Evacuation - Evacuation orders will be given based on the 'know your zone' scheme. Go to Know Your Zone and find which of the four zones you are in. Helpful tip - go to LINK and enter your address in the upper left 'find address or place'. Good luck.
Sunday, June 18, 2017
New Paper by Billy Sweet and colleagues
https://www.ncdc.noaa.gov/monitoring-content/sotc/national/2017/may/2016_StateofHighTideFlooding.pdf
2016 State of U.S. High Tide Flooding and a 2017 Outlook
William V. Sweet1 , John J. Marra2 , Gregory Dusek1
National Oceanic and Atmospheric Administration’s Center for Operational Oceanographic Products and Services1 and National Centers for Environmental Information2 Summary
The number of days with high tide flooding in 2016 was above the local flood‐frequency trend at the majority of the 28 locations examined (more than half of the trends are accelerating in time). Three all‐ time records for annual‐flood days were either tied (Key West, FL) or broken (Charleston, SC; Savannah, GA). If an El Nino develops this coming year (May 2017 ‐ April 2018) as model guidance suggests is possible, the frequency of daily floods may be compounded relative to long‐term trends, upwards of 25% or more at several U.S. West and East Coast locations.
https://www.ncdc.noaa.gov/monitoring-content/sotc/national/2017/may/2016_StateofHighTideFlooding.pdf
2016 State of U.S. High Tide Flooding and a 2017 Outlook
William V. Sweet1 , John J. Marra2 , Gregory Dusek1
National Oceanic and Atmospheric Administration’s Center for Operational Oceanographic Products and Services1 and National Centers for Environmental Information2 Summary
The number of days with high tide flooding in 2016 was above the local flood‐frequency trend at the majority of the 28 locations examined (more than half of the trends are accelerating in time). Three all‐ time records for annual‐flood days were either tied (Key West, FL) or broken (Charleston, SC; Savannah, GA). If an El Nino develops this coming year (May 2017 ‐ April 2018) as model guidance suggests is possible, the frequency of daily floods may be compounded relative to long‐term trends, upwards of 25% or more at several U.S. West and East Coast locations.
Thursday, February 9, 2017
Sea Level Rise for Hampton Roads 2016
Sea Water Levels at Sewells Point, VA
With the end of the year, it is a good time to recap the data we have on flooding events and sea level rise for the Hampton Roads region.
Hourly Data at Sewells Point

Average Annual Sea Level at Sewells Point
Because this is hourly data it is highly variable. Here is the annual average of the hourly data from Sewells Pt.

10 year moving average at Sewells Point
We can take a 10 year moving average of the annual average to smooth out the interannual variations to get a better view of the long term trend.

The long-term average rate of increase is about 0.3 meters per 70 years (approximately) or 0.4 meters per century or about 1.5 feet per century. Note this is the running 10-year average so the first 10 years are truncated (the 1938 value is the average of the past 10 years).
Hours per year of 'Nuisance Flooding'

The top panel shows the hours per year that water levels at Sewells Point were above the NWS defined nuisance flood level of 0.53 m above MHHW.
The lower panel shows the hourly Sewells Point water level. The solid horizontal line shows 0.53 m - the nuisance flood level. Sea level is rising causing there to be more nuisance flooding hours.

Blue line - Now - A one-meter flooding even occurs about every 3-4 years. A 1.4 meter flooding event occurs about every 33 years now.
Red line - 2050 with 0.5 m (1.5 feet) sea level rise - If sea level rises 0.5 meters as expected by 2050 a one-meter flooding event will be every year or more often and a 1.4 meter flood every 2 to 3 years.
The way to interpret this that flooding events that occurred once during a Hampton Roads resident's lifetime will occur several times during their children's.

I've labeled the major storm events. Note I'd like to know what the early May event was called.
Each line is the average monthly temperature for a year. The heavy line is the monthly average data from 2016. Month months in 2016 had near record high average levels at Sewells Point.

You will notice that the highest water levels during any year are often in September. This is because the ocean waters are warmest then and they have expanded - making sea level higher. This is a seasonal effect.

The lower panel shows the hourly Sewells Point water level. The solid horizontal line shows 0.53 m - the nuisance flood level. Sea level is rising causing there to be more nuisance flooding hours.
Return Period of Flooding Events

Red line - 2050 with 0.5 m (1.5 feet) sea level rise - If sea level rises 0.5 meters as expected by 2050 a one-meter flooding event will be every year or more often and a 1.4 meter flood every 2 to 3 years.
The way to interpret this that flooding events that occurred once during a Hampton Roads resident's lifetime will occur several times during their children's.
Rate of Sea Level Rise
NOAA sea level trend


Quoting the NOAA site (Link to NOAA Site)
More plots of interannual and seasonal trends are at the NOAA website.The mean sea level trend is 4.59 millimeters/year with a 95% confidence
interval of +/- 0.23 mm/yr based on monthly mean sea level data from
1927 to 2015 which is equivalent to a change of 1.51 feet in 100 years."
The Past Year - 2016
Here are the Sewells Pt plots for the past year
I've labeled the major storm events. Note I'd like to know what the early May event was called.
2016 compared to other years

You will notice that the highest water levels during any year are often in September. This is because the ocean waters are warmest then and they have expanded - making sea level higher. This is a seasonal effect.
Florida Current Transport

Over the past few years it has become evident that sea level in Hampton Roads is to some extent related to the strength of the Gulf Stream or the Florida Current. (They are the same. It is called Florida Current off Florida). You will note how it varies.
The reduced transport in early October coincided with Hurricane Mathew when is slowed over the Florida Current and apparently the southward winds slowed the Current. More on this from a paper Tal Ezer submitted.
The reduced transport in early October coincided with Hurricane Mathew when is slowed over the Florida Current and apparently the southward winds slowed the Current. More on this from a paper Tal Ezer submitted.
How this measurement is made can be found at Link to NOAA Florida Transport
Subscribe to:
Posts (Atom)