Sea Level Rise Update 2018
This is the annual look at seawater levels at the NOAA Sewells Point water level gauge. I'm trying to do this every year.
Caution -
- There are many nuances to this data and interpretations of it.
- Do not make decisions based on the information here
- Contact me if you plan to use the information presented here.
Some Key Points
- The average annual water level for the whole year 2018 was the highest since 1928.
- Hours of nuisance flooding was 5th highest since 1928.
- The monthly average water level was the highest on record in June, September and December. It was the second highest in March and July.
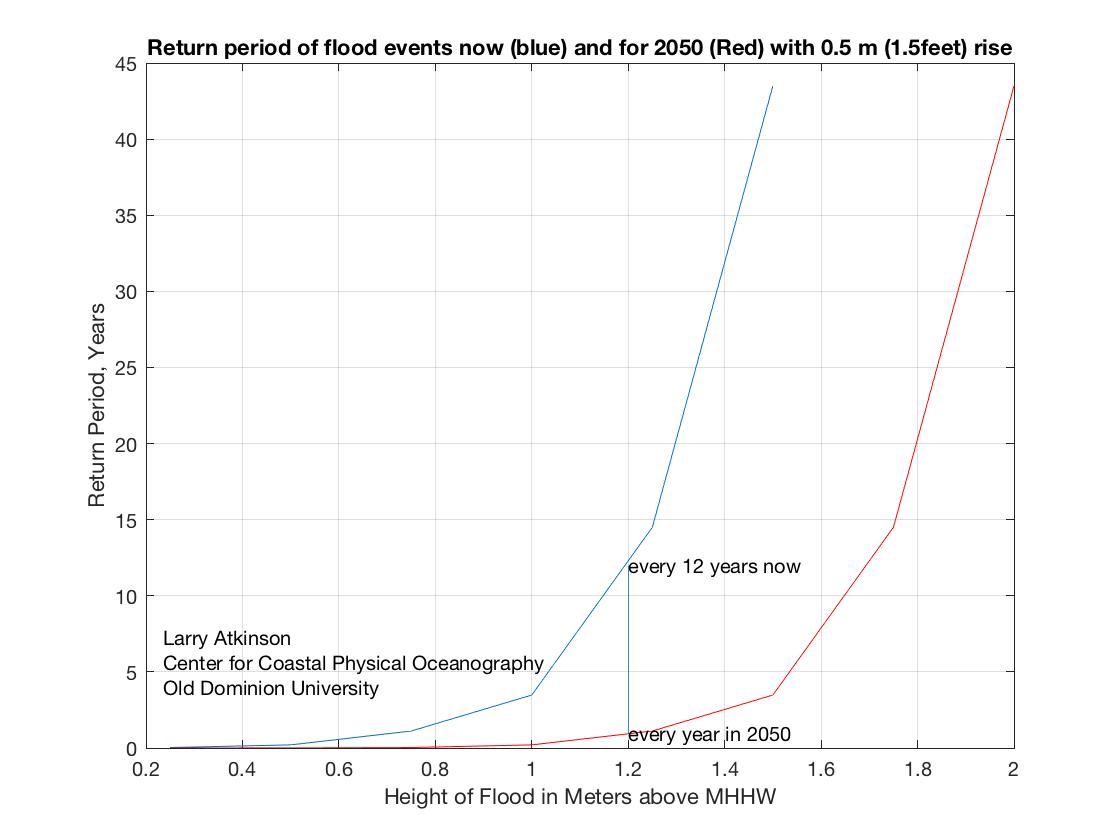
- By 2050 floods that used to happen every 12 years will happen every year.
Note: all plots are referenced to Mean Higher High Water (MHHW).
Hours per year of nuisance flooding
First, the iconic plot of hours of nuisance flooding per year.

Nuisance flooding is a value determined by the National Weather Service in collaboration with regional emergency managers. It is 0.53 meters above Mean Higher High Water.
The upper plot shows two things:
1. there are occasional years with abnormally high hours of flooding. These are typical during a major hurricane or northeasters with long durations in the area.
2. a slow, steady increase from about 2005.
Based on this plot we can expect at least 40 to 50 hours of nuisance flooding per year in the coming years.
The lower panel shows the hourly water level since 1927. Since it is hourly you can see the twice-daily range in tides of about 1.5 meters or 3 feet. You can also see the occasional higher values well above 1 meter when hurricanes and northeasters pass our region.
Because of sea level rise, the water levels are slowly increasing. The solid line is the nuisance flooding value of 0.53 m. You can see how the daily tides are slowly reaching more often into the nuisance flooding value. This is why we have more flooding.
Note - the hours of flooding is calculated assuming that any water level point above 0.53 m represents one hour of flooding.
Average Monthly Water Level Movie
Now for something new - an animation of the monthly water level values from 1928 to the present
The hourly plot for 2018
Remember, this is a plot of the water level every hour so you see the tidal range of a few feet.
You can see that the water level can change over the months. In January it went from below -0.5 to averaging above 0 in March. Changes in the ocean, wind fields and passage of hurricanes and northeasters cause these longer-term changes.
Monthly Averages
We often hear things like 'this was the hottest month in history', or, 'the hottest year in history'. Well, we can do the same thing with the water level at Sewells Point.
This plot shows the monthly average water level at Sewells Point since 1927. Each line represents one year. The heavy line shows the 2018 data.
First, you notice that water levels are always higher in the late summer and lowest in the winter months. This is because the ocean waters are warmer in the summer and the ocean expands a bit each summer: in this case about 0.5 meters or 1.5 feet.
The data for 2018 (the heavy line shows that water levels monthly averages were among the highest.
Ranking of months
This table shows that the average monthly water level was the highest ever in June, September, and December. It was the second highest in March and July.
1 2 3 4 5 6 7 8 9 10
January 2016 1998 2005 2010 2017 1996 2011 1993 2013 1987
February 1998 2005 2010 1999 1983 2016 2013 1993 1973 2017
March 2010 2018 2013 2014 1983 2011 1987 2016 2012 2003
April 2010 2018 2013 2014 1983 2011 1987 2016 2012 2003
May 2017 2005 1998 2011 2016 2008 2014 2006 2012 1999
June 2018 2009 2012 2014 2011 2016 1997 2017 2005 2010
July 1975 2018 2017 2015 2012 2009 2005 2011 2016 2014
August 2017 2014 2011 2010 1995 2013 2015 1998 2018 2012
September 2018 2017 2016 2015 2009 2003 2014 2011 2006 2004
October 2015 2016 2013 2004 2009 2005 2018 2012 2002 2017
November 1928 1931 1936 1933 1934 1941 1929 1930 1943 1940
December 2018 2009 2012 2014 1996 2015 2010 2011 2016 1997
Yearly Average
In 2018 the average water level was the highest since records began in 1928.
Ranking of years: 2018, 2016, 2010, 2017, 2014, 2012, 2009, 2011, 2005, 1998, 2013, 2015, 2006, 1996, 2003
The ranking of highest years is: 2018 2016 2010 2017 2014 2012 2009 2011 2005 1998
8 of 10 highest annual average was since 2000.
Flooding Return Period
This shows that at present a flood of 1.2 meters above MLLW occurs about every 12 years. With a 0.5-meter water level rise the return period will be about every year. Or, a flood that used to happen every 12 years will, in 50 years, happen every year.
Trends
The figure above is directly from the NOAA website. The linear trend is about 4.6 ft per century. Note that most careful analysis of these records strongly suggest that the rate is not linear.
The
Sea Level Rise Report Cards produced at the Virginia Institute of Marine Science are an excellent source of information on acceleration rates and the causes of sea level rise.
I urge you to go to that site for more information on projected rise rates.
They calculate the current linear rate at 5.2 mm/year and the acceleration rate as 0.1 mm/year.
Background information
All the data are from the NOAA data archive for Sewells Point.
LINK
All water levels are referenced to MHHW. To convert to different datums see
LINK
All data are one hour. Note that verified 6-minute data are available at this station since 1996. Using 6-minute data would give you more accurate hourly flooding data.
If you want the full data sets please contact me.