A recent paper in Earth's Future by Horton et al titled "Probabilistic 21st and 22nd century sea-level projections at a global network of tide gauge sites" has a nice description of the siituation in Norfolk in addition to NYC and Key West.
I've broken up the text copied from the paper for readability
Note that R is "ratio of Local Sea Level change driven by land ice and oceanographic components to Global Sea Level change driven by those same components".
From section 3.4 Local sea-level projections: examples
To illustrate the importance of local factors for sea-level rise projections, we consider several sites along the coasts of the United States where different factors dominate LSL (local sea level) change (Tables 2, 4). While we focus on projections for RCP[Representative Concentration Pathways Link) 8.5 as a way of highlighting the differences between GSL(global sea level) and LSL, similar considerations apply to other RCPs, which are shown in the tables.
New York City experiences greater-than-global sea-level rise under almost all plausibleprojections, with a likely range of 0.7–1.3 m by 2100 under RCP 8.5. Three factors enhance sealevel rise at New York. First, due to its location on the subsiding peripheral bulge of the former Laurentide Ice Sheet, the site experiences GIA (glacial isostatic adjustment)-related sea-level rise of 1.3± 0.2 mm/y. Second, the rotational effects of WAIS mass loss increases the region’s sea-level response to WAIS mass loss by about 20% [et al.(2009), Gomez, and Clark]. Third, as noted in earlier papers [et al.(2009), Schlesinger, and Stouffer, and Goddard(2013), et al.(2010), Mitrovica, Griffies, Yin, Hay, and Stouffer], changes in the Gulf Stream may result in dynamic sea-level rise in the mid- Atlantic U.S. This enhancement can be seen by examining the difference between oceanographic sea-level rise at New York and the global average, which has a median of 14 cm and a likely range of -6 to +35 cm. These three effects are partially counteracted by the ∼55% reduction in the sea-level response due to GIS mass loss, associated with the gravitationally-induced migration of water away from of this relatively proximal ice mass. Indeed, the climatic factors that amplify and reduce LSL rise relative to GSL rise are nearly balanced in the median projection ( R = 1.03, with a likely range of 0.73–1.30), with GIA effects pushing local rise to levels that exceed the global rise.
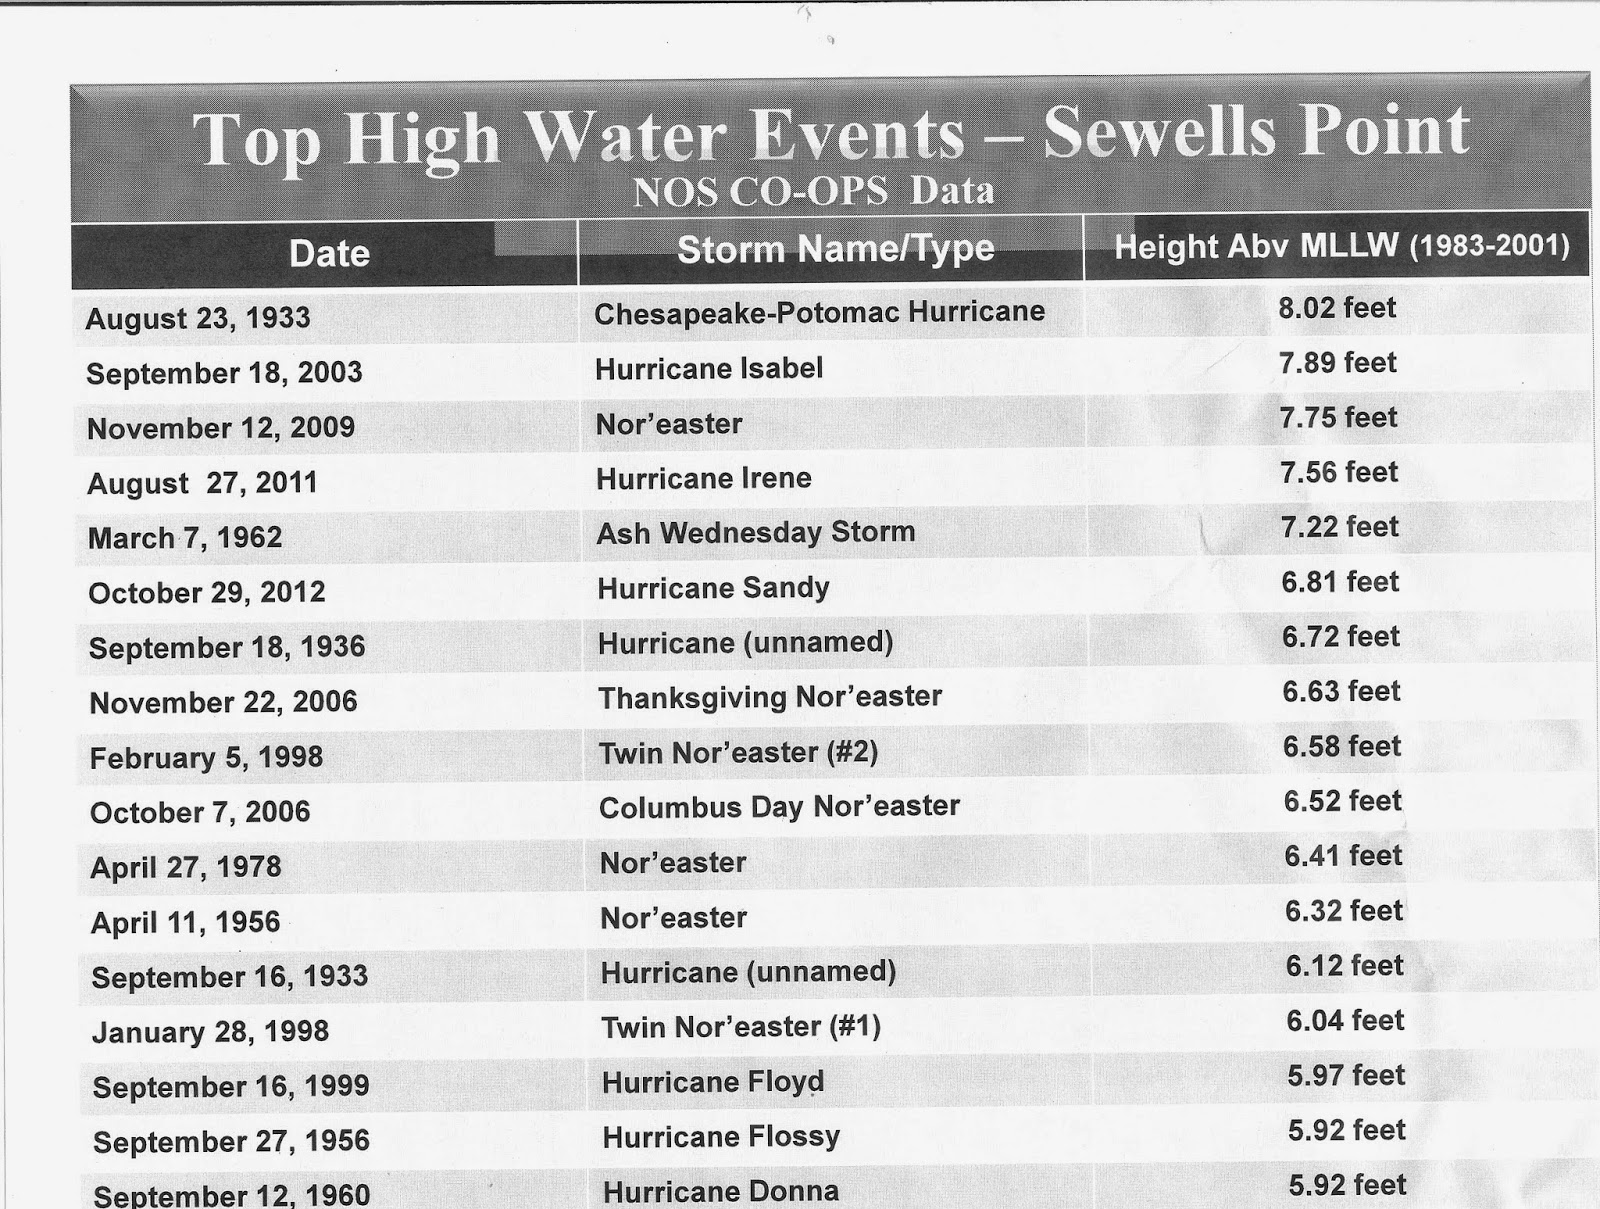
Sewell’s Point in Norfolk, VA, is projected to experience higher-than-global mean sea level rise due to the same factors as New York City: subsidence due to GIA, enhanced influence of WAIS mass loss, and exposure to changes in the Gulf Stream.
Being located farther south along the U.S. East Coast, Norfolk experiences somewhat smaller ocean dynamic changes (median and likely ocean dynamic sea-level rise increment of 9 cm and -8–26 cm) but greater sea-level rise due to GIS mass loss (experiencing about ∼ 45% less sea-level rise than the global mean).
Its R value (1.00, likely range of 0.75–1.22) is similar to New York City.
However, whereas New York City sits upon bedrock, Norfolk is located on the soft sediments of the Coastal Plain [et al.(2013), Kopp, Horton, Browning, and Kemp].
As a consequence, it is exposed to sea-level rise due to both natural sediment compaction and compaction caused by groundwater withdrawal, which increases the background non-climatic rate of sea-level rise to 2.5 ± 0.3 mm/y.
Accordingly, the likely range of LSL rise for RCP 8.5 in 2100 is 0.8–1.3 m.
Sea-level rise at Key West, Florida, is closer to the global mean, with a likely range in RCP 8.5 by 2100 of 0.6–1.1 m (median R = 1.00 , likely range of 0.83–1.15, background rise of 0.5 ± 0.4 mm/y). By contrast, the deltaic western Gulf of Mexico coastline experiences some of the fastest rates of sea-level rise in the world as a result of groundwater withdrawal and hydrocarbon production [et al.(2011), Allison, and Hameed, and Tremblay(1995)]. At Galveston, Texas, a background subsidence rate of 4.6 ± 0.3 mm/y drives a likely range of sea-level rise by 2100 in RCP 8.5 of 1.0–1.5 m. Because the uncertainty in subsidence rate is small relative to other sources of uncertainty, this causes a shift in the range rather than a broadening of overall uncertainty, as occurs at New York City (reflected in a likely R of 0.78–1.13, which is narrower than at New York City).