Sea Water Levels at Sewells Point, VA
With the end of the year, it is a good time to recap the data we have on flooding events and sea level rise for the Hampton Roads region.
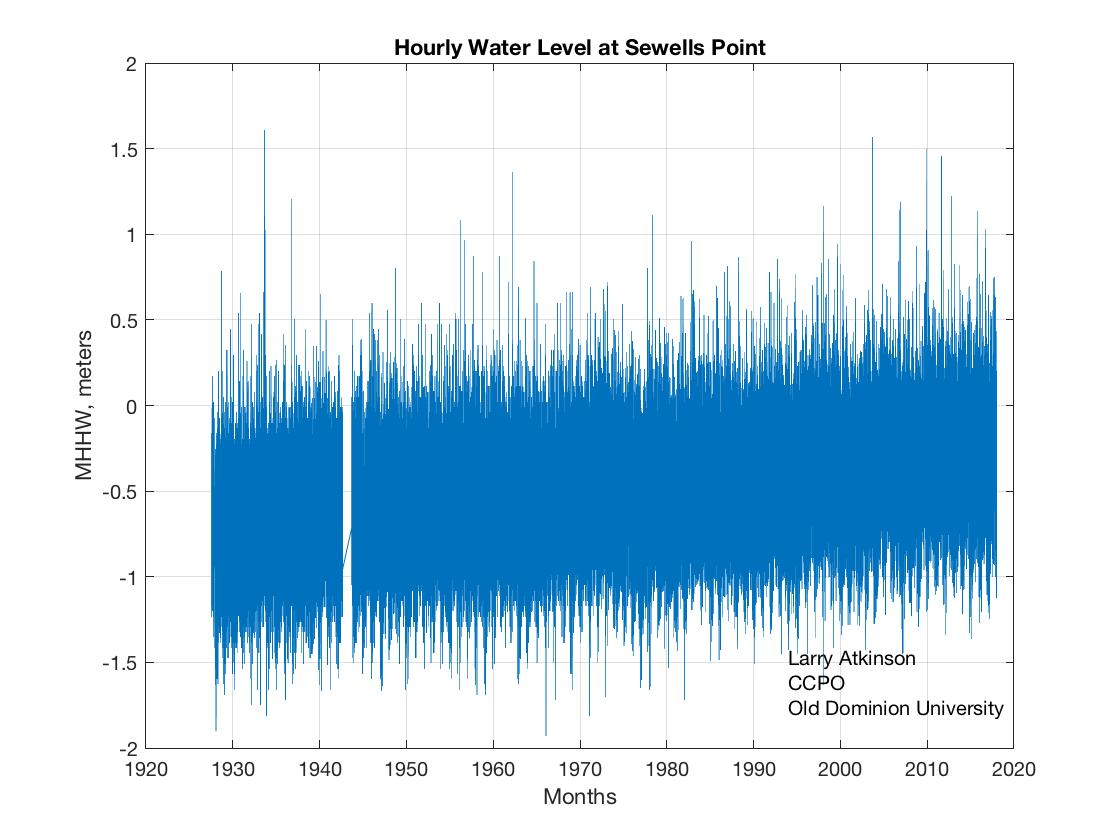
Hourly Data at Sewells Point
Average Annual Sea Level at Sewells Point

10 Year moving average at Sewells Point

Hours per year of Nuisance Flooding

Return Period of Flooding Events

Rate of Sea Level Rise

The trend has increased from 4.59 to 4.61mm/year since last year.
The past year - 2017

2017 Compared to other years by month

You will notice that the highest water levels during any year are often in September. This is because the ocean waters are warmest then and they have expanded - making sea level higher. This is a seasonal effect.
No comments:
Post a Comment