Thursday, November 13, 2014

Land Motion Measurements

As we all know the land in the mid-Atlantic is sinking or subsiding.

This post links to a NOAA system call CORS - Continuously Operating Reference System - that measures very accurately earth motion.

The link to the main page is http://geodesy.noaa.gov/CORS/

The long-term data plots I looked at were all rather short and many have ended.

Nevertheless there may be good subsidence information here.


Friday, October 31, 2014

Long Awaited Report on Sea Level Rise risk to Norfolk Navy Base released

The report titled "Risk Quantification for Sustaining
 Coastal Military Installation Asset and Mission
Capabilities (RC-1701)" by Kelly A. Burks-Copes and many colleagues. We here at ODU have hosted Kelly several times and heard her presentation on this work. Now it is published. Here is the LINK to the report.
This modeling done to produce the products in this report are a good example of how to do a risk analysis of this challenge. Good reading.

Wednesday, October 15, 2014

NOAA water level data - Matlab files

I've downloaded most NOAA water level stations from east coast into Matlab 'mat' files.
They are at data link
Disclaimer - no guarantee with this data. If you going to use it check very carefully to make sure it is correct. It is referenced to MHHW.

Sunday, October 12, 2014

State by State SLR reports

Having just got a link to a report by New Hampshire I'm going to put together a list of what might be called official or state government requested reports created by state entities stating SLR rates.

Reports states are doing are often about adapting to SLR so they will or may have a statement about what SLR rate to adapt to.

I'll put all this in a page on this blog as the list builds but here are three that I'm aware of now.

Here are the links. Go to them to make sure you get the correct information.

Delaware
Maryland
New Hampshire
New York Report
Virginia
Florida
Rhode Island
Connecticut
New Jersey


Here are the rise rates stated in the reports  - go to the report linked above to see the basis for their guidance. I use their units.

NOTE - data below needs updating

Delaware (2012)

Three scenarios to 2100
0.5 m (1.6 ft),  1.0 m ( 3.3 ft) and 1.5 m (4.9 ft)

Maryland (2013)

2050 Best 0.4 m(1.4 ft)
2050 Low 0.3 m (0.9 ft)
2050 High 0.7 m (2.1 ft)

2100 Best 1.1 m (3.7 ft)
2100 Low 0.7 m (2.1 ft)
2100 High 1.7 m (5.7 ft)

New Hampshire (2014)

2050 Intermediate Low 0.6 ft, High 1.3 ft, Highest 2.0 ft
2100 Intermediate Low 1.6 ft, High 3.9 ft, Highest 6.60 ft


New York for Lower Hudson Valley & Long Island (2010)

Sea level rise
2020s 2 2 to 5 in

Sea level rise with rapid ice‐melt scenario
2020s 3 5 to 10 in
2050s 19 to 29 in
2080s 41 to 55 in

New Jersey (2019) Please look at the report as this is the most sophisticated analysis that I know of by a state. I'll try to summarize it so it compares to other states. All state planners should look at this analysis.

Virginia (2013)

1.5 feet by 2050

Florida (2010)
0.5 to 1.0 m by 2100 (directly from IPCC)

Conversions 

1 inch = 0.0254 m
1 foot = 0.3048 m


Sunday, October 5, 2014

Virginia Beach SLR Adaptation Plan

The City of Virginia Beach and the Hampton Roads Planning District Commission has just released a report titled "Developing a Local Sea Level Rise Adaptation Plan for Virginia Beach". Link to report

The authors are Benjamin J. McFarlane, Hampton Roads Planning District Commission Hampton Roads Planning District Commission
and

Whitney K. McNamara, CFM 723 Woodlake Drive, City of Virginia Beach Planning Department

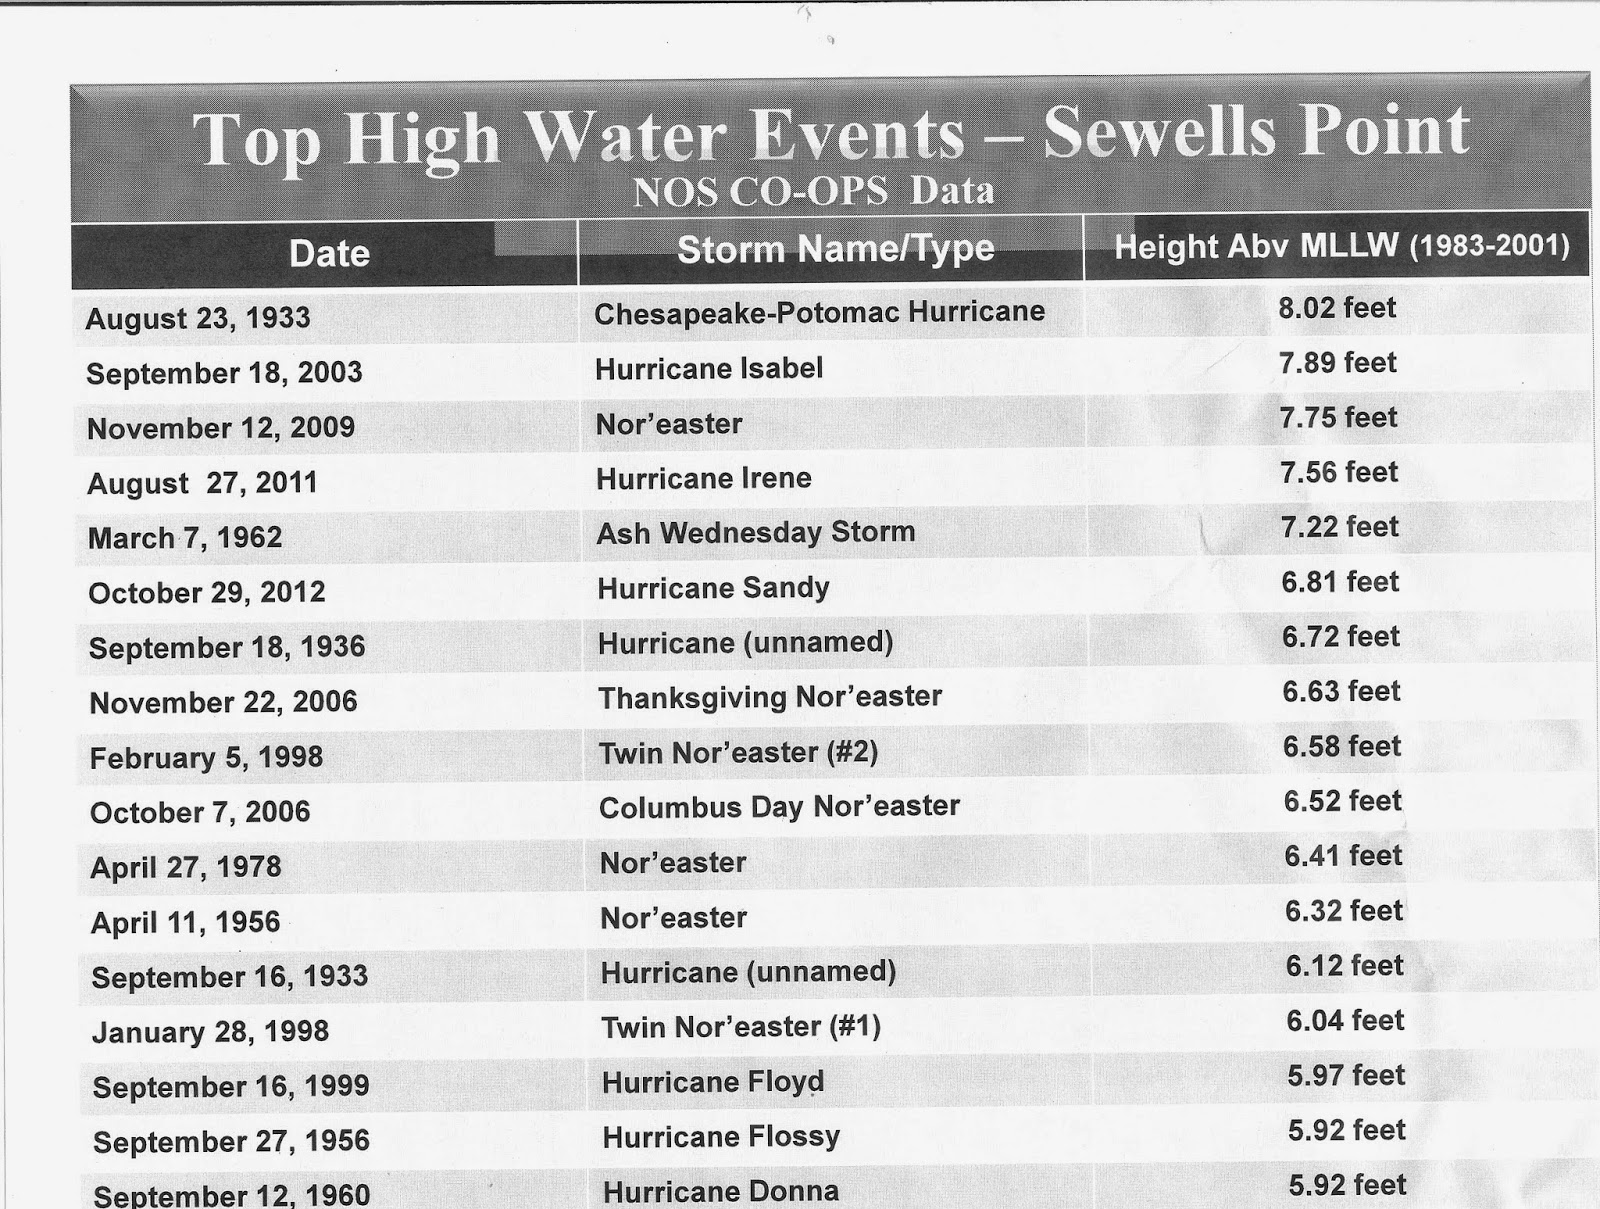
Flooding maps are included.

They conclude:

Specifically, the City of Virginia Beach will:
1) Use the case studies and other information developed for this report to update existing
city policies;
2) Develop and update outreach materials such as those described in this report as part of
its comprehensive plan update process and ongoing public engagement activities;
3) Use the case studies and other information to help develop a city-wide strategy to
address recurrent flooding and sea level rise.
The Hampton Roads Planning District Commission will:
1) Continue developing and providing policy recommendations related to recurrent
flooding and sea level rise to local governments in Hampton Roads;
2) Use the mapping methodology described in this report to develop regional sea level rise
and storm surge inundation maps to support vulnerability analyses and other technical
services for local governments.

Friday, October 3, 2014

South Florida SLR


Nice publication titled "Water, Water, Everywhere: Sea Level Rise in Miami"

by scientists at RSMAS explaining SLR in SE Florida LINK"

Friday, September 26, 2014

NOAA Tide Gauge Data in Matlab format

I routinely gather hourly water level data from NOAA tide gauge databases.

If you use Matlab  - the are two 'mat' files for each NOAA water level station: one for 'Height' and one for 'Date'. Height in meters and Data in Matlab 'datenum' format.

Here is the link Matlab file links

Tuesday, September 9, 2014

NOAA CO-OPS Inundation Analysis Tool

NOAA CO-OPS Inundation Analysis Tool

Just saw this nice new tool - http://tidesandcurrents.noaa.gov/inundation/

From the User Guide
The inundation analysis tool provides frequency and duration of inundation statistics above a specified threshold elevation at a given location using observed data from the NOAA Center for Operational Oceanographic Products and Services’ tide stations. The analysis uses six-minute interval time series, with observed times and heights of high waters (tides). Initially developed by the CO-OPS Coastal Oceanographic Applications and Services of Tides and Lakes (COASTAL) Program for the purposes of marsh restoration and planning, the program potentially has broader applications for the coastal engineering and mapping community, including analyzing return frequencies for coastal flooding threshold elevations and/or user specified datum elevations.
Here is a snippet from Sewells Point for early 2014 using MHHW as the reference.

This might be useful for engineers and planners.

Coastal Flooding Perfect Combination

A period of spring tides combined with heavy rains are causing more than nuisance flooding in parts of the mid-Atlantic. Winds switched to the north on the 7th adding to the higher tide and flooding.


Saturday, August 2, 2014

CO-OPS Report on "Sea Level Rise and Nuisance Flood Frequency Changes around the United States"

An important new report on what we here in Tidewater Virginia call nuisance flooding. Here is link to the report. 

They nicely quantify the increasing nuisance flooding at many locations in the US including our favorite Sewells Point in Norfolk. Here  is one figure relevant to Hampton Roads.

I'll summarize their findings a week or so.


Information about flood levels at http://tidesandcurrents.noaa.gov/coastal.html

Inundation analysis tool http://tidesandcurrents.noaa.gov/inundation/


Friday, July 25, 2014

Storm Surge Events in Hampton Roads

We often want to know what were the extreme flood events in Hampton Roads (and other places)

NOAA has a great site called Extreme Water Levels  that has information relevant to planners, engineers and scientiststs.

Information for Sewells Point is at LINK At the bottom of that page they have the data for extreme specific events.


Thanks to Chris Zervas and his colleagues at NOAA


Thursday, July 3, 2014

Discussion of East Coast SLR in Horton et al 2014

A recent paper in Earth's Future by Horton et al titled "Probabilistic 21st and 22nd century sea-level projections at a global network of tide gauge sites" has a nice description of the siituation in Norfolk in addition to NYC and Key West.

I've broken up the text copied from the paper for readability

Note that R is "ratio of Local Sea Level change driven by land ice and oceanographic components to Global Sea Level change driven by those same components".

From section 3.4 Local sea-level projections: examples

To illustrate the importance of local factors for sea-level rise projections, we consider several sites along the coasts of the United States where different factors dominate LSL (local sea level) change (Tables 2, 4). While we focus on projections for RCP[Representative Concentration Pathways Link) 8.5 as a way of highlighting the differences between GSL(global sea level) and LSL, similar considerations apply to other RCPs, which are shown in the tables.
New York City experiences greater-than-global sea-level rise under almost all plausibleprojections, with a likely range of 0.7–1.3 m by 2100 under RCP 8.5. Three factors enhance sealevel rise at New York. First, due to its location on the subsiding peripheral bulge of the former Laurentide Ice Sheet, the site experiences GIA (glacial isostatic adjustment)-related sea-level rise of 1.3± 0.2 mm/y. Second, the rotational effects of WAIS mass loss increases the region’s sea-level response to WAIS mass loss by about 20% [et al.(2009), Gomez, and Clark]. Third, as noted in earlier papers [et al.(2009), Schlesinger, and Stouffer, and Goddard(2013), et al.(2010), Mitrovica, Griffies, Yin, Hay, and Stouffer], changes in the Gulf Stream may result in dynamic sea-level rise in the mid- Atlantic U.S. This enhancement can be seen by examining the difference between oceanographic sea-level rise at New York and the global average, which has a median of 14 cm and a likely range of -6 to +35 cm. These three effects are partially counteracted by the ∼55% reduction in the sea-level response due to GIS mass loss, associated with the gravitationally-induced migration of water away from of this relatively proximal ice mass. Indeed, the climatic factors that amplify and reduce LSL rise relative to GSL rise are nearly balanced in the median projection ( R = 1.03, with a likely range of 0.73–1.30), with GIA effects pushing local rise to levels that exceed the global rise.
Sewell’s Point in Norfolk, VA, is projected to experience higher-than-global mean sea level rise due to the same factors as New York City: subsidence due to GIA, enhanced influence of WAIS mass loss, and exposure to changes in the Gulf Stream.
Being located farther south along the U.S. East Coast, Norfolk experiences somewhat smaller ocean dynamic changes (median and likely ocean dynamic sea-level rise increment of 9 cm and -8–26 cm) but greater sea-level rise due to GIS mass loss (experiencing about ∼ 45% less sea-level rise than the global mean).
Its R value (1.00, likely range of 0.75–1.22) is similar to New York City.
However, whereas New York City sits upon bedrock, Norfolk is located on the soft sediments of the Coastal Plain [et al.(2013), Kopp, Horton, Browning, and Kemp].
As a consequence, it is exposed to sea-level rise due to both natural sediment compaction and compaction caused by groundwater withdrawal, which increases the background non-climatic rate of sea-level rise to 2.5 ± 0.3 mm/y.
Accordingly, the likely range of LSL rise for RCP 8.5 in 2100 is 0.8–1.3 m.
Sea-level rise at Key West, Florida, is closer to the global mean, with a likely range in RCP 8.5 by 2100 of 0.6–1.1 m (median R = 1.00 , likely range of 0.83–1.15, background rise of 0.5 ± 0.4 mm/y). By contrast, the deltaic western Gulf of Mexico coastline experiences some of the fastest rates of sea-level rise in the world as a result of groundwater withdrawal and hydrocarbon production [et al.(2011), Allison, and Hameed, and Tremblay(1995)]. At Galveston, Texas, a background subsidence rate of 4.6 ± 0.3 mm/y drives a likely range of sea-level rise by 2100 in RCP 8.5 of 1.0–1.5 m. Because the uncertainty in subsidence rate is small relative to other sources of uncertainty, this causes a shift in the range rather than a broadening of overall uncertainty, as occurs at New York City (reflected in a likely R of 0.78–1.13, which is narrower than at New York City).

Wednesday, May 28, 2014

High tides and no wind - what is going on?

As I write this the tides in our area are running almost a foot above predicted from astronomical calculations.
Why is that?

The NOAA Extra Tropical Water Level guidance is located at http://www.nws.noaa.gov/mdl/etsurge/index.php?page=stn&region=me&type=both&stn=vahamp

In this blog I want to note the anomaly that often occurs along our coast.

By anomaly I mean a higher water level that is not explained by normal astronomical tide prediction or the wind. Or, as stated in the manual associated with the guidance

From the NOAA Manual that is linked to the site "This "Anomaly" is averaged over 5 days, and is then added to the future predictions of the tide and storm surge to predict the Total Water Level"

Now here is an example - .


The lines are defined at the top of the plot. 
The black line is the 'Total Water Guidance' that includes both the storm surge and the anomaly. 

In this case the surge contributes about .3 feet for a day or so then goes to zero

The Anomaly (Green line) is about 0.5 feet. 

The question is "What is the anomaly?" This is important because with the added Anomaly the water levels will be over the highest 18 year tides and will flood some streets in coastal cities. 

Dr. Tal Ezer at Old Dominion University has found that the anomaly is related to the speed of the Gulf Stream. He has found that the transport of the Gulf Stream is well correlated with our water levels: the Gulf Stream slows down and our water level goes up or the Gulf Stream speeds up and our water level goes down.

Dr. Tom Rossby (URI) has a paper out with an analysis showing no slowing of the Gulf Stream.

This is an area of active research.